
Ir al contenido

Esta página aún no está disponible en español. Está leyendo la versión en inglés. Abrir la página en inglés

Infographic

TFA Concentration in Organic & Conventional Wine
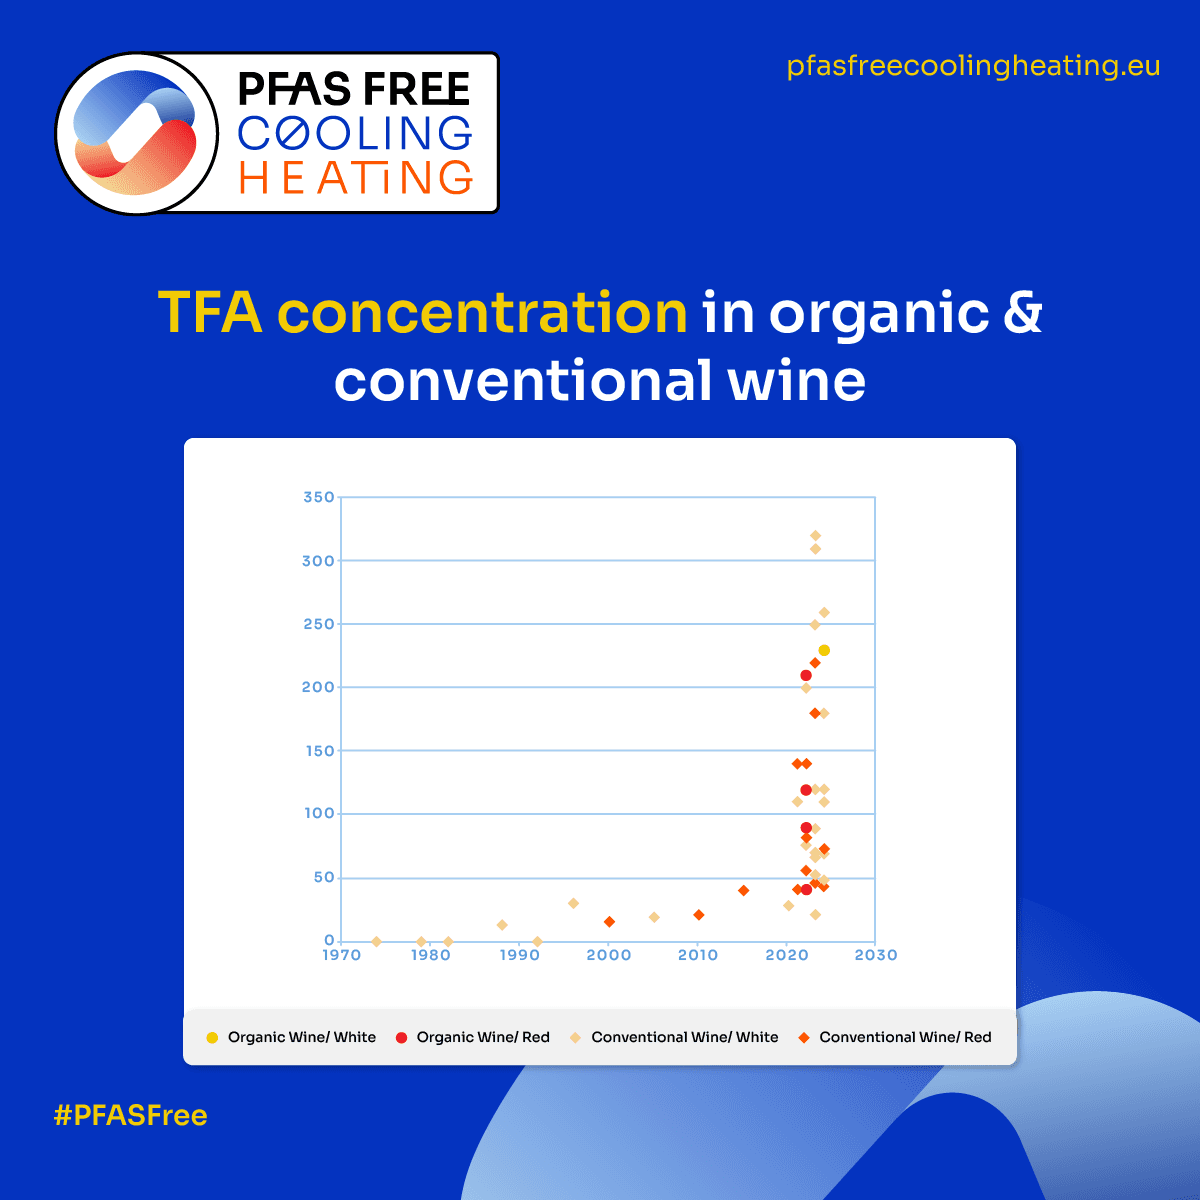
Scatter chart of TFA concentration in wine by vintage year, from 1970 to 2030, for organic white, organic red, conventional white and conventional red wines. Vintages before 2000 sit close to zero and stay below about 40 until 2015. Samples from around 2020 onwards spread from about 20 up to about 320, with organic wines between about 40 and 230.
Wines from the 1970s to the 1990s show little or no TFA; recent vintages, organic and conventional, show far more.Source: to be confirmed
What the figure shows

Scatter chart of TFA concentration in wine by vintage year, from 1970 to 2030, for organic white, organic red, conventional white and conventional red wines. Vintages before 2000 sit close to zero and stay below about 40 until 2015. Samples from around 2020 onwards spread from about 20 up to about 320, with organic wines between about 40 and 230.

Descargar PNG: TFA Concentration in Organic & Conventional Wine

Read the TFA storySee more infographics