
Ir al contenido

Esta página aún no está disponible en español. Está leyendo la versión en inglés. Abrir la página en inglés

Infographic

TFA Concentration in Leaf Samples
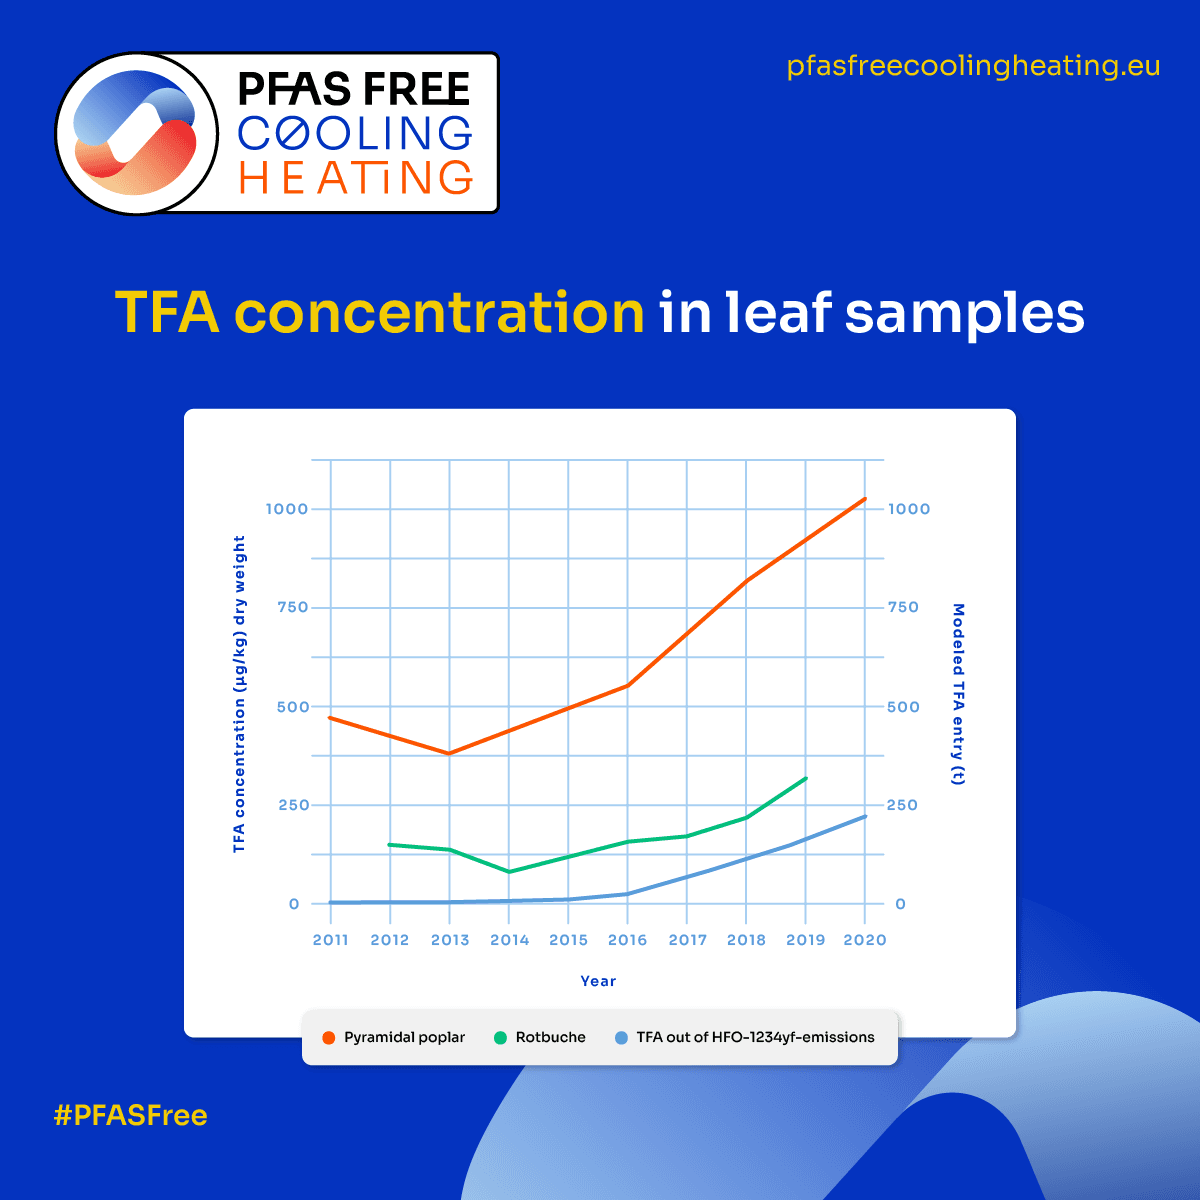
Line chart, 2011 to 2020, of TFA concentration in leaf samples in micrograms per kilogram dry weight. Pyramidal poplar falls from about 470 in 2011 to about 380 in 2013, then rises to about 1,030 in 2020. Rotbuche (common beech) rises from about 150 in 2012 to about 320 in 2019. A third line on a second axis, modelled TFA entry from HFO-1234yf emissions in tonnes, rises from near zero to about 220 in 2020.
TFA in poplar leaves passed 1,000 µg/kg dry weight by 2020, rising with modelled TFA from HFO-1234yf.Source: to be confirmed
What the figure shows

Line chart, 2011 to 2020, of TFA concentration in leaf samples in micrograms per kilogram dry weight. Pyramidal poplar falls from about 470 in 2011 to about 380 in 2013, then rises to about 1,030 in 2020. Rotbuche (common beech) rises from about 150 in 2012 to about 320 in 2019. A third line on a second axis, modelled TFA entry from HFO-1234yf emissions in tonnes, rises from near zero to about 220 in 2020.

Descargar PNG: TFA Concentration in Leaf Samples

Read the TFA storySee more infographics