
Aller directement au contenu

Cette page n’est pas encore disponible en français. Vous lisez la version anglaise. Ouvrir la page en anglais

Infographic

TFA in Switzerland Groundwater
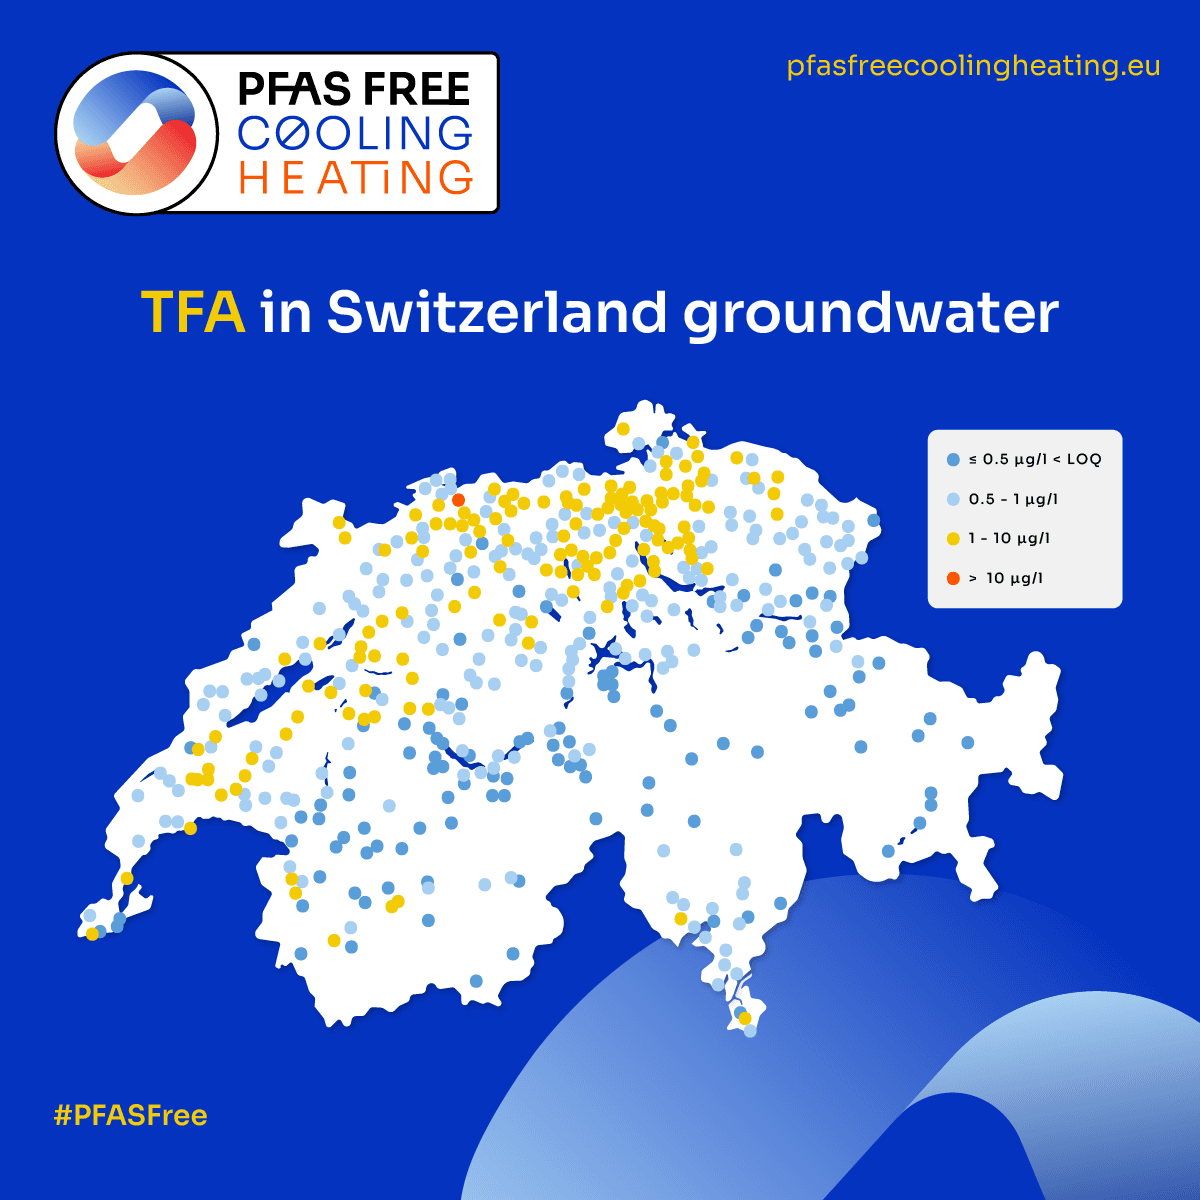
Map of Switzerland with several hundred groundwater sampling points, coloured by TFA concentration: up to 0.5 µg/l (below the limit of quantification), 0.5 to 1 µg/l, 1 to 10 µg/l, and above 10 µg/l. Points between 1 and 10 µg/l cluster across the north and west of the country; one site in the north is above 10 µg/l. Lower values dominate the Alps in the south.
Many sites across northern and western Switzerland measure 1–10 µg/l of TFA; one exceeds 10 µg/l.Source: to be confirmed
What the figure shows

Map of Switzerland with several hundred groundwater sampling points, coloured by TFA concentration: up to 0.5 µg/l (below the limit of quantification), 0.5 to 1 µg/l, 1 to 10 µg/l, and above 10 µg/l. Points between 1 and 10 µg/l cluster across the north and west of the country; one site in the north is above 10 µg/l. Lower values dominate the Alps in the south.

Télécharger le fichier PNG: TFA in Switzerland Groundwater

Read the TFA storySee more infographics